

Updated November 3, 2026.
A good golf outing starts with understanding the people you want to bring together. This reference connects participation, recorded play, amateur performance and community programs with the practical questions tournament organizers ask.
The figures come from original research and program reports. Most describe completed reporting periods, and each observation carries its period and source. National golfer counts, handicap-system records and commercial tracking samples have different boundaries; none is presented as a count of tournaments using scoring software.
Key Takeaways
- On-course golfers: 29.1 million (2025). (National Golf Foundation, November 2026)
- All-format participants: 48.1 million (2025). (National Golf Foundation, November 2026)
- Public-access share of courses and facilities: Approximately 75% (End of 2025). (National Golf Foundation, November 2026)
- Total scores posted: 82.25 million (2025). (USGA, January 2026)
- Youth on Course member rounds: 1.52 million (2025). (Youth on Course, January 2026)
- Male average Handicap Index: 14.0 (2025). (USGA, January 2026)
- Female average Handicap Index: 28.8 (2025). (USGA, January 2026)
- Competition scores posted: 4.6 million (2025). (USGA, January 2026)
- Handicap 30+ group: driver shots requiring penalty or recovery: 45.1% (2025). (Arccos Golf, May 2026)
- PGA Jr. League registrations: 81,009 (2025). (PGA of America REACH Foundation, November 2026)
- Golf-related charitable fundraising: Almost $4.6 billion (2022). (National Golf Foundation, October 2023)
- 100 Hole Hike fundraising: More than $2.1 million (2025). (Youth on Course, March 2026)
How large is the pool of potential golf-outing players?
Build an outing around the players you can welcome, rather than an imagined field of experts. Participation research gives useful context for recruitment, but it does not identify how many people will enter your event. The national categories distinguish on-course players from people whose golf takes place entirely away from a course.
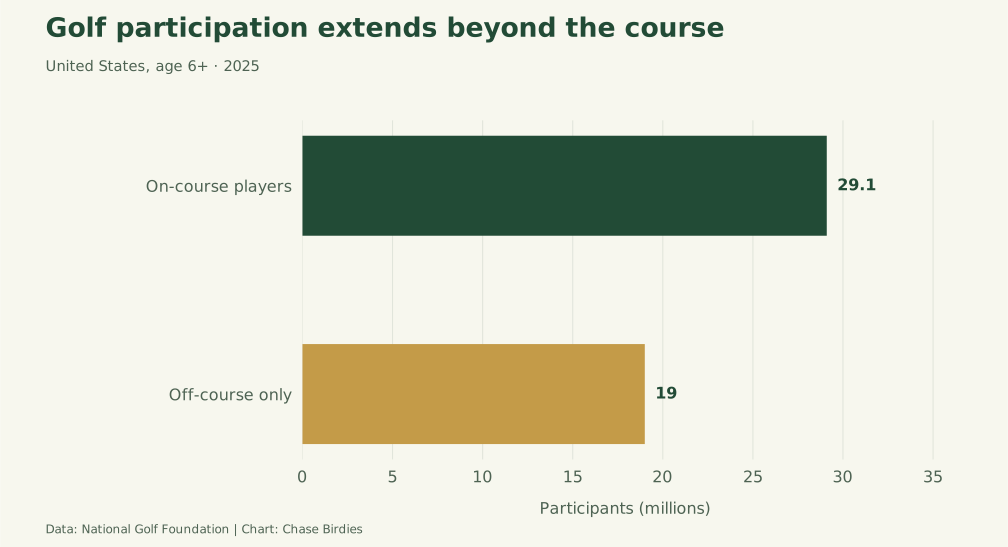
Who is participating on and off the course?
The on-course and off-course-only categories separate different ways of playing. A potential outing participant might have experience at a driving range without having played a full course. That distinction is useful when deciding what information to include before the event. Explain arrival, scoring responsibilities and the day’s structure in ordinary language. Participation totals provide background for that decision, rather than evidence that a particular format is preferred. The rows retain the age and participation labels used by the researcher; the overlapping young-adult categories should not be added to an overall golfer count.
| Measure | Reporting period | Statistic and source |
|---|---|---|
| Off-course-only participants | 2025 | 19 million (National Golf Foundation, November 2026) |
| On-course beginners | 2025 | 3.3 million (National Golf Foundation, November 2026) |
| Young adult on-course golfers, ages 18–34 | 2025 | 6.3 million (National Golf Foundation, November 2026) |
| Young adults participating only off course | 2025 | More than 7 million (National Golf Foundation, November 2026) |
| Non-golfing young adults very interested in on-course golf | 2025 | More than 7.5 million (National Golf Foundation, November 2026) |
How is female participation changing?
The female participation measures describe a changing national audience. Counts, shares and changes answer different questions, so the reporting windows remain attached. A growth percentage should not be read as the percentage of all golfers who are female. Likewise, off-course-only participants and on-course beginners belong to different populations. For an organizer, the practical response is to make invitations and event instructions welcoming to people with varied experience. These observations do not establish how much any participant will spend, whether they will enter a competition, or which scoring format they will enjoy.
| Measure | Reporting period | Statistic and source |
|---|---|---|
| Female on-course golfers | 2025 | 8.1 million (National Golf Foundation, November 2026) |
| Female share of on-course golfers | 2025 | 28% (National Golf Foundation, November 2026) |
| Female participation growth since 2019 | 2019–2025 | 46% (National Golf Foundation, November 2026) |
| Net increase in female on-course golfers since 2019 | 2019–2025 | 2.5 million (National Golf Foundation, November 2026) |
| Female share of beginners | 2025 | 35% (National Golf Foundation, November 2026) |
| Female share of off-course-only participants | 2025 | 43% (National Golf Foundation, November 2026) |
Where does future interest come from?
Interest is a survey response, not a registration. NGF’s latent-demand measure concerns people who did not play on a course during the reporting year but expressed strong interest. The junior measures describe a separate participant group. Neither is a forecast for a local event. Use this background to ask better questions about the people you hope to invite: whether they have played before, what support they need and what would make the day approachable. Keep that invitation process distinct from an estimate of the total addressable market.
| Measure | Reporting period | Statistic and source |
|---|---|---|
| Non-golfers very interested in on-course golf | 2025 | 21.2 million (National Golf Foundation, November 2026) |
| Growth in latent demand since 2019 | 2019–2025 | 37% (National Golf Foundation, November 2026) |
| Junior participation growth since 2019 | 2019–2025 | 58% (National Golf Foundation, November 2026) |
| Girls’ share of junior golfers | 2025 | 35% (National Golf Foundation, November 2026) |
| People of Color share of junior golfers | 2025 | 26% (National Golf Foundation, November 2026) |
How much golf is played, and where can people play?
Available golf is not the same thing as available tee times. Course-supply research describes the national footprint; score-posting data describes recorded play within a separate system. Use both as background when choosing an outing, then ask the venue about its actual dates, starting arrangements and capacity.
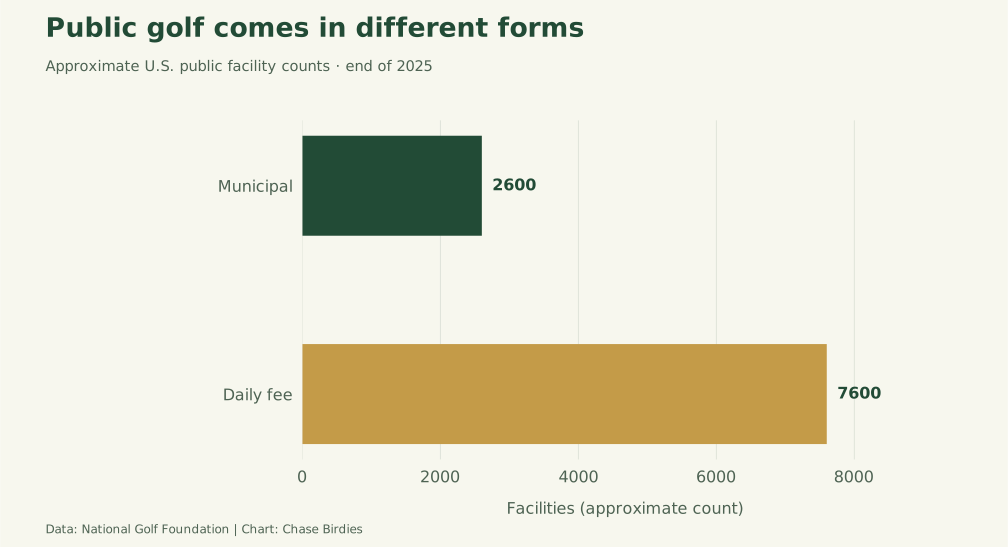
What does course supply tell an organizer?
Courses and facilities are different units. A facility can contain more than one course, while municipal and daily-fee categories describe ways the public can access the game. The estimates below are national, rounded figures. They do not show local availability, prices or suitability for a large group. An organizer still needs to confirm the proposed format and starting plan with the course. The broad rounds comparison is historical context for demand, rather than a promise that a specific venue is busy on a particular date.
| Measure | Reporting period | Statistic and source |
|---|---|---|
| Annual rounds in each year of the stated window | 2020–2025 | More than 500 million (National Golf Foundation, November 2026) |
| Rounds above pre-pandemic average | 2020–2025 vs. 2015–2019 | 21% (National Golf Foundation, November 2026) |
| Golf courses at year end | End of 2025 | Approximately 16,000 (National Golf Foundation, November 2026) |
| Golf facilities at year end | End of 2025 | Approximately 14,000 (National Golf Foundation, November 2026) |
| Municipal facilities | End of 2025 | Approximately 2,600 (National Golf Foundation, November 2026) |
| Daily-fee facilities | End of 2025 | Approximately 7,600 (National Golf Foundation, November 2026) |
What do posted scores and rated courses measure?
Posted scores are records in a handicapping system; they are not a census of all rounds. Course Rating coverage also has a different scope from the industry’s inventory of golf facilities. Keep the two systems separate rather than calculating a coverage rate from their totals. Hole-by-hole posting describes how scores were submitted to the USGA system. It does not demonstrate adoption of live tournament leaderboards, and the comparison here should not be described as software market share. These boundaries make the figures useful without assigning them claims they cannot support.
| Measure | Reporting period | Statistic and source |
|---|---|---|
| Share of scores posted hole by hole | 2025 | 38.6% (USGA, January 2026) |
| Hole-by-hole posting increase | 2024–2025 change | 3.7 percentage points (USGA, January 2026) |
| Nine-hole share of posted scores | 2025 | 18.2% (USGA, January 2026) |
| Rated short and par-3 courses | 2025 | 473 (USGA, January 2026) |
| Short/par-3 rated tees | 2025 | 2,302 (USGA, January 2026) |
| Rated courses | 2025 | 12,355 (USGA, January 2026) |
| Rated facilities | 2025 | 10,928 (USGA, January 2026) |
How much play comes through subsidized access?
Subsidized access offers a program-level view of actual play. Youth on Course reports member rounds and their annual change, which can include repeated visits by the same person. A round is not a new member, and a funded round is not necessarily a round already played. For an outing aimed at newer golfers, this distinction helps separate participation opportunities from the event’s own registrations. Keep your roster count, attendance count and rounds completed as separate measures so that later reporting is understandable.
| Measure | Reporting period | Statistic and source |
|---|---|---|
| Member-round growth | 2024–2025 change | 46% (Youth on Course, January 2026) |
What do handicaps and score postings reveal about players?
A Handicap Index is useful context for a field, but it is not the same as a golfer’s expected total score. The USGA’s records describe people maintaining an index and the scores they post. They do not capture every recreational golfer, every casual round or every organized outing.
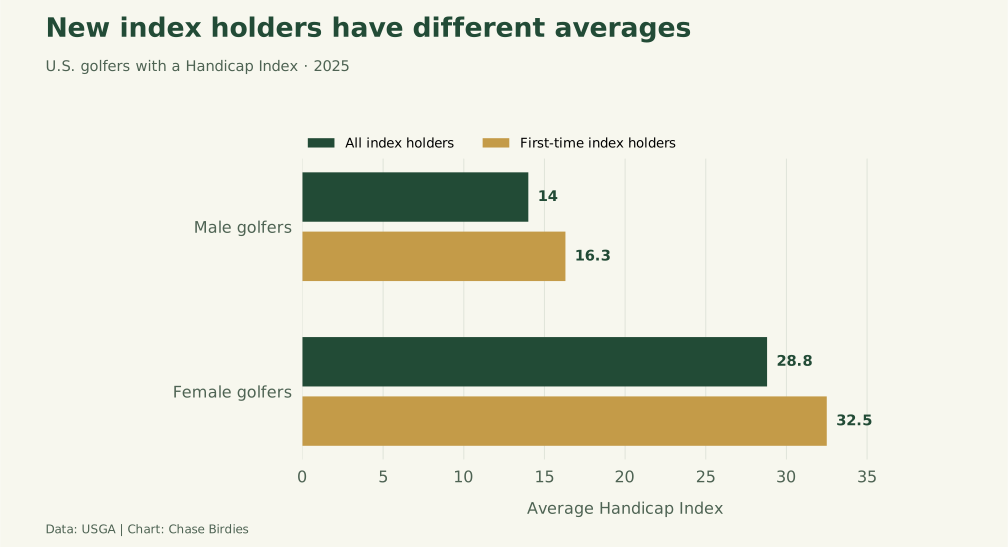
What does the handicap-holding population look like?
An index summarizes demonstrated ability within the handicapping system. It should not be renamed an average gross score or the number of strokes someone will shoot over par in a particular event. The report distinguishes established golfers from people receiving an index for the first time; those new index holders are not necessarily new to golf. The averages also describe groups, not individual expectations. When designing an event, follow the applicable competition rules and clearly explain the scoring method rather than using a population average as a substitute for a player’s own information.
| Measure | Reporting period | Statistic and source |
|---|---|---|
| Golfers maintaining a Handicap Index | 2025 | 3.68 million (USGA, January 2026) |
| First-time Handicap Index holders | 2025 | 537,000 (USGA, January 2026) |
| New male average Handicap Index | 2025 | 16.3 (USGA, January 2026) |
| New female average Handicap Index | 2025 | 32.5 (USGA, January 2026) |
How often do golfers post scores?
Posting frequency describes recorded activity. These figures do not show every round played, and counts at higher thresholds are nested inside the lower-threshold groups. Do not add the threshold counts as separate populations. The Playing Conditions Calculation percentage refers to cases in which the calculation could run, not the proportion of all rounds that became harder. Caps and exceptional-score reductions belong to the handicapping system. They should not be presented as evidence of cheating or as a count of tournament scoring errors.
| Measure | Reporting period | Statistic and source |
|---|---|---|
| Average scores posted per male golfer | 2025 | 23 (USGA, January 2026) |
| Average scores posted per female golfer | 2025 | 19 (USGA, January 2026) |
| Golfers posting at least twenty scores | 2025 | 1.42 million (USGA, January 2026) |
| Golfers posting at least fifty scores | 2025 | 511,600 (USGA, January 2026) |
| Scores posted on the day of play | 2025 | 65% (USGA, January 2026) |
| Cases receiving a nonzero Playing Conditions Calculation | 2025 | 7.9% (USGA, January 2026) |
| Golfers affected by a soft or hard cap | 2025 | 696,000 (USGA, January 2026) |
| Exceptional scores posted | 2025 | 230,000 (USGA, January 2026) |
How much score posting is marked as competition?
A competition score is a designation on a score record. It is not a tournament, a team registration or an event-software customer. The counts below can include multiple scores from one golfer and have rounded values that should not be forced to reconcile exactly. They show why an organizer should distinguish entrants from rounds and results. For a practical setup, read the tournament planning checklist, then make the chosen format and score-entry responsibilities clear to the field. See how hole-by-hole scoring works and how to share a live leaderboard.
| Measure | Reporting period | Statistic and source |
|---|---|---|
| Golfers posting a competition score | 2025 | 873,000 (USGA, January 2026) |
| Male golfers posting a competition score | 2025 | 725,000 (USGA, January 2026) |
| Female golfers posting a competition score | 2025 | 148,000 (USGA, January 2026) |
| Nine-hole competition scores | 2025 | 995,000 (USGA, January 2026) |
| Eighteen-hole competition scores | 2025 | 3.6 million (USGA, January 2026) |
How different are amateur golfers’ on-course performances?
A mixed-skill field can contain very different games. Arccos measures actual driver shots among its users, which makes the report useful for understanding variation without pretending it represents every golfer. Distance includes rollout, and the results are not normalized for weather, turf or elevation.
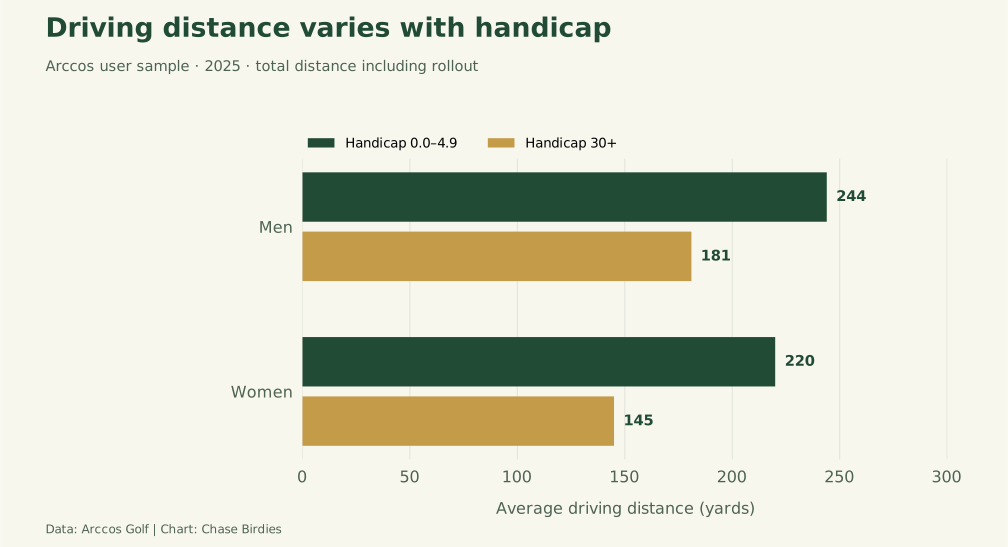
How far do different player groups drive?
The cohort averages describe driver shots on the course, rather than a launch-monitor test of maximum carry distance. Each row preserves its age or handicap group. These comparisons help illustrate the range of players an outing might welcome; they do not tell an organizer which tee every individual should use. Consult the course and participants about suitable tees and communicate the event rules consistently. Do not assume the observed difference between two groups will be reproduced in a particular field. The sample consists of Arccos users and is not a random sample of all golfers.
| Measure | Reporting period | Statistic and source |
|---|---|---|
| Men: overall mean drive | 2025 | 224.19 yards (Arccos Golf, May 2026) |
| Men aged 15–19: mean drive | 2025 | 240 yards (Arccos Golf, May 2026) |
| Men aged 70–79: mean drive | 2025 | 190 yards (Arccos Golf, May 2026) |
| Men, Handicap Index 0.0–4.9: mean drive | 2025 | 244 yards (Arccos Golf, May 2026) |
| Men, Handicap Index 30+: mean drive | 2025 | 181 yards (Arccos Golf, May 2026) |
| Women aged 20–29: mean drive | 2025 | 201 yards (Arccos Golf, May 2026) |
| Women aged 60–69: mean drive | 2025 | 158 yards (Arccos Golf, May 2026) |
| Women, Handicap Index 0.0–4.9: mean drive | 2025 | 220 yards (Arccos Golf, May 2026) |
| Women, Handicap Index 30+: mean drive | 2025 | 145 yards (Arccos Golf, May 2026) |
How does driving accuracy vary?
Fairways hit and shots kept in play measure different things. A drive can miss the fairway without requiring recovery or a penalty, so those percentages should not be combined as if they share one definition. Age and handicap comparisons are observational, and the report’s groups have different underlying players. For a mixed field, clear scoring instructions and a format people understand are more useful than treating a broad average as an individual prediction. Compare the tournament formats before deciding how the group will compete.
| Measure | Reporting period | Statistic and source |
|---|---|---|
| Men aged 20–29: fairways hit | 2025 | 38% (Arccos Golf, May 2026) |
| Men aged 70–79: fairways hit | 2025 | 56% (Arccos Golf, May 2026) |
| Men, Handicap Index 0.0–4.9: fairways hit | 2025 | 50% (Arccos Golf, May 2026) |
| Men, Handicap Index 30+: fairways hit | 2025 | 40% (Arccos Golf, May 2026) |
| Women aged 20–29: fairways hit | 2025 | 46% (Arccos Golf, May 2026) |
| Women aged 60–69: fairways hit | 2025 | 63% (Arccos Golf, May 2026) |
| Handicap scratch–4.9 group: driver shots kept in play | 2025 | 88% (Arccos Golf, May 2026) |
What do elevation and age comparisons show?
The elevation comparison concerns the report’s representative handicap group under actual playing conditions. The age comparison concerns a specified low-handicap male cohort. Neither is a controlled experiment: the report does not hold weather, turf, player characteristics and every other condition constant. Avoid promising a distance gain to someone visiting a higher course or describing a cross-sectional age difference as one player’s inevitable decline. For an outing, use the observations as a reminder to check course conditions and communicate local guidance. They do not support a change to someone’s official handicap on their own.
| Measure | Reporting period | Statistic and source |
|---|---|---|
| Ten-handicap golfer: mean drive at sea level | 2025 | 220.5 yards (Arccos Golf, May 2026) |
| Ten-handicap golfer: mean drive above five thousand feet | 2025 | 239.7 yards (Arccos Golf, May 2026) |
| Men, handicap 0.0–4.9: distance decrease from twenties to seventies | 2025 | 54 yards (Arccos Golf, May 2026) |
How are junior and team programs expanding access?
Team programs and affordable access can create routes into organized golf. Read their counts as program measures rather than a national census of junior tournament entrants. Scholarship awards, registrations, rounds and membership each describe a different part of that pathway.
What do team golf and scholarships report?
Team registrations show engagement with a named program. Scholarship categories show forms of assistance and may overlap; adding them would risk inventing a total the report does not claim. The current program page and the fiscal report also use different reporting periods. Keep each period with the corresponding figure rather than assuming that a website counter supersedes every historical report measure. These observations support discussion of access and organized play. They do not measure the effectiveness of a particular tournament format or demonstrate that a software tool increases junior participation.
| Measure | Reporting period | Statistic and source |
|---|---|---|
| Jr. League financial-assistance scholarships | April 2024–March 2025 report | 4,542 (PGA of America REACH Foundation, February 2026) |
| Jr. League military scholarships | April 2024–March 2025 report | 377 (PGA of America REACH Foundation, February 2026) |
| Jr. League Sigma Pi Phi scholarships | April 2024–March 2025 report | 171 (PGA of America REACH Foundation, February 2026) |
| First Tee x TPC Network Initiative scholarships | April 2024–March 2025 report | 119 (PGA of America REACH Foundation, February 2026) |
How do organized programs connect players with opportunities?
The collegiate championship and scholarship program describe separate opportunities. A scholarship recipient is not automatically a participant in the reported championship, and these counts should not be added as unique people reached. The fiscal report’s introduction identifies calendar-year activity within its reporting window; the labels below retain that distinction. If you are running an event for a school, club or community group, use your own registration and eligibility records for the field. The national program data provides context, while the event needs its own accurate roster and scoring instructions.
| Measure | Reporting period | Statistic and source |
|---|---|---|
| PGA WORKS Collegiate Championship student-athletes | Calendar 2024 activity in fiscal report | 184 (PGA of America REACH Foundation, February 2026) |
| PGA WORKS scholars | April 2024–March 2025 report | 25 (PGA of America REACH Foundation, February 2026) |
What does subsidized youth access look like?
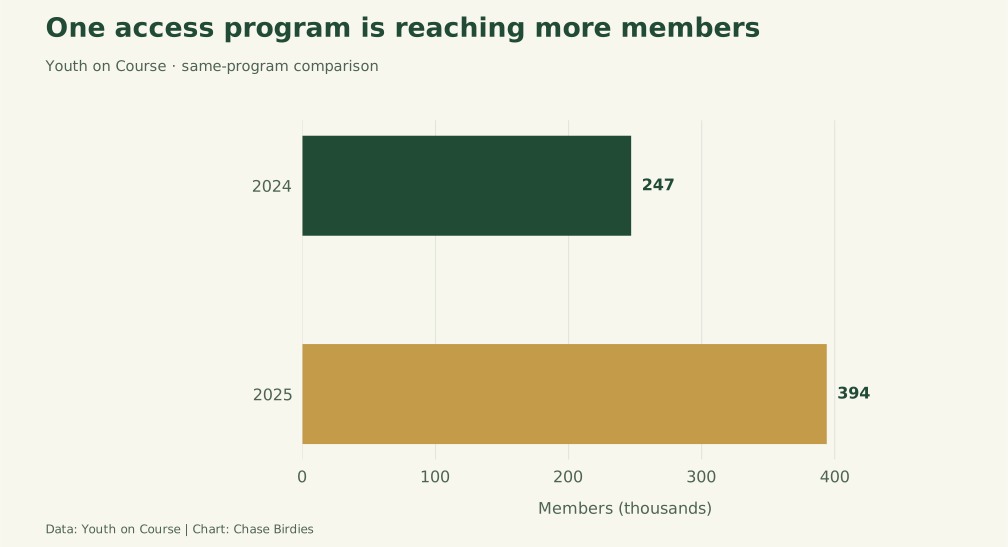
Membership, rounds, outdoor hours and reported family savings are different measures of program use. They should not be combined into a participation count or presented as a controlled study of health outcomes. The prior-year membership comparison is useful because it refers to the same organization, but it is not a national youth-golf growth rate. Keep the organization’s estimate language when quoting outcomes. An organizer considering an access-focused event can use the report to frame questions about affordability and repeat play, then measure those questions directly in the local program.
| Measure | Reporting period | Statistic and source |
|---|---|---|
| Youth on Course members | 2025 | 394,000 (Youth on Course, January 2026) |
| Member growth | 2024–2025 change | 59% (Youth on Course, January 2026) |
| Reported outdoor time | 2025 | 4.6 million hours (Youth on Course, January 2026) |
| Reported walking distance | 2025 | 5.7 million miles (Youth on Course, January 2026) |
| Reported annual family savings | 2025 | $22.9 million (Youth on Course, January 2026) |
| Youth on Course members in prior year | 2024 | 247,000 (Youth on Course, January 2026) |
What do charity outings and community programs contribute?
Golf fundraising works at many scales, and one successful campaign cannot forecast another outing’s result. The older national estimate below belongs to a specific research year; the newer program reports describe named organizations. Keep fundraising, participant counts, supported rounds and service delivery separate.
How much charitable activity was associated with golf?
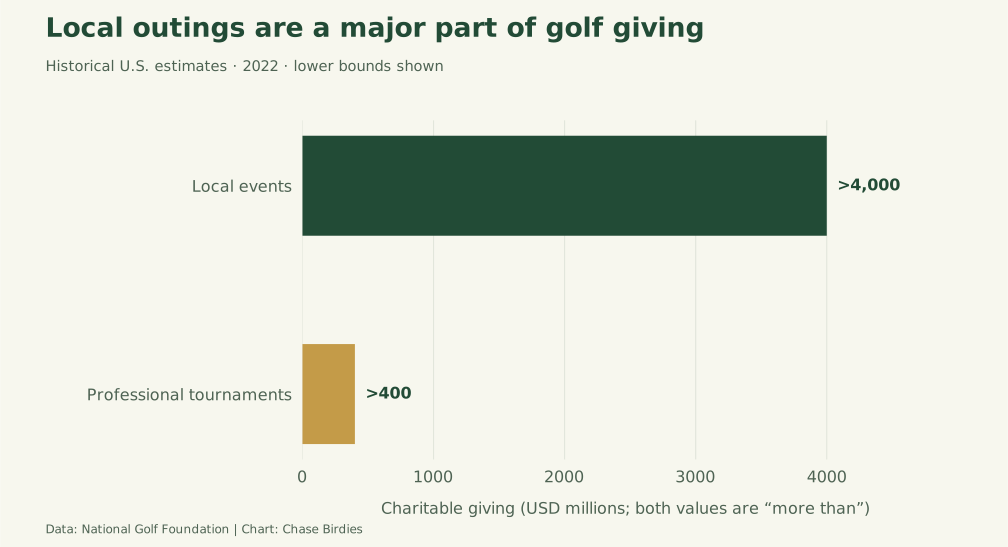
This national estimate is historical. Its publication year and observation year are different, and it should not be relabeled as the amount raised this year. The local-event and professional-tournament figures describe different parts of golf-related giving, while the facility measure describes places hosting charitable activity. A place can host multiple events, so a facility count is not an event count. The report does not provide an expected net return for an individual outing. Build your own budget from confirmed costs, sponsor commitments and registration assumptions instead of treating an industry total as a benchmark for success.
| Measure | Reporting period | Statistic and source |
|---|---|---|
| Fundraising increase since previous estimate | 2016–2022 comparison | About 18% (National Golf Foundation, October 2023) |
| Facilities hosting charitable golf | 2022 | Approximately four in five (National Golf Foundation, October 2023) |
| Locations hosting charitable golf | 2022 | More than 11,000 (National Golf Foundation, October 2023) |
| Professional-tournament charitable giving | 2022 | More than $400 million (National Golf Foundation, October 2023) |
| Local-event charitable fundraising | 2022 | More than $4 billion (National Golf Foundation, October 2023) |
What does one recent fundraising program report?
The 100 Hole Hike reports a specific fundraising campaign, its participants and the rounds it helped fund. Those funded rounds are an access outcome, rather than additional rounds claimed as completed during the fundraiser itself. The amounts retain the source’s lower-bound language. Do not divide rounded headline figures to invent an average fundraising target for a hiker or predict what a new event will raise. If you are planning a fundraiser, start with the charity golf checklist and document the distinction between gross receipts, costs and money delivered to the beneficiary.
| Measure | Reporting period | Statistic and source |
|---|---|---|
| 100 Hole Hike participants | 2025 | More than 760 (Youth on Course, March 2026) |
| Subsidized rounds funded by the hike | 2025 | More than 400,000 (Youth on Course, March 2026) |
How do foundation events and service programs reach communities?
Event fundraising and service-program delivery answer different questions. The foundation’s fiscal report separates money raised through its events from people served and program locations under PGA HOPE. The report introduction describes calendar-year program activity within the fiscal window, so these measures should not be called current-year totals. They illustrate different ways an organization can report community work without combining dollars, people and places. A local organizer can follow that discipline: explain what was measured, define the period and keep the supporting records. Review the tournament setup guide when moving from the budget to the event plan.
| Measure | Reporting period | Statistic and source |
|---|---|---|
| PGA REACH event fundraising | April 2024–March 2025 report | More than $1.12 million (PGA of America REACH Foundation, February 2026) |
| PGA HOPE veterans and active-duty military served | April 2024–March 2025 report | 13,753 (PGA of America REACH Foundation, February 2026) |
| PGA HOPE program locations | April 2024–March 2025 report | 532 (PGA of America REACH Foundation, February 2026) |
Methodology and Sources
This edition contains 100 distinct metric-period observations checked against original reports or original-producer releases on November 3, 2026. The edition date does not turn historical data into current-year results. Citation dates identify publication or release months where documented; November 2026 denotes access for undated current pages. The Arccos PDF is the original researcher’s document hosted by MyGolfSpy, which is credited as host rather than researcher. Rounded values and lower bounds are retained. The inventory records sources, periods, locations and scope. Charts visualize selected counted observations and add none to the total. Review monthly and advance the update stamp only after source checks; no automated refresh is implied.
Glossary
- NGF: National Golf Foundation, producer of the participation, supply and historical charity research cited here.
- USGA: United States Golf Association.
- Handicap Index: The handicapping system’s measure of demonstrated ability; distinct from a gross score, Course Handicap or Playing Handicap.
- WHS: World Handicap System.
- PCC: Playing Conditions Calculation; the adjustment data here concerns calculation cases, not all rounds.
- PGA REACH: PGA of America REACH Foundation, producer of the cited program report.
- PGA HOPE: Helping Our Patriots Everywhere, a golf program for veterans and active-duty military.
- On-course / off-course-only: NGF participation categories distinguishing people who played on a course from those participating only elsewhere.
- Fairways hit / kept in play: Different driving outcomes; a drive can miss a fairway without requiring a penalty or recovery shot.
- Percentage point: The arithmetic difference between two percentages, distinct from relative percentage change.
Sources
- National Golf Foundation: Golf Industry Facts: 2026 edition
- USGA: 2025 Golf Scorecard
- USGA: 2025 Golf Scorecard release
- Arccos Golf: Annual Driving Distance Report: 2026 Edition, original Arccos report hosted by MyGolfSpy
- Arccos Golf: 2026 Driving Distance Report release
- PGA of America REACH Foundation: PGA Jr. League impact
- PGA of America REACH Foundation: April 2024–March 2025 Impact Report
- Youth on Course: Youth on Course Celebrates 20 Years of Historic Growth and Impact
- Youth on Course: Year on Course: 2025
- National Golf Foundation: Golf’s Unrivaled Charitable Impact